When we published our equity market outlook for 2023, we had mentioned where pockets of opportunity could be found. The correction the market is going through provides fertile grounds for stock picking. So here, we tell you how to pick stocks in 2023, in those pockets that we had noted. We do this using our Stock Screener.

Mid and small caps
Though the Midcap 150 index has performed in-line with Nifty 50, the Smallcap 100 is still languishing at its 2018 levels. Since all the stocks below the 100th stock in market capitalisation falls under the mid and small cap category, it opens up a wide spectrum of stocks in the sub- Rs.50,000 crore marketcap universe.
Filtering out the really small ones with market caps of less than Rs 1,000 crore, there are about 900 stocks (going by NSE-listed stocks alone).
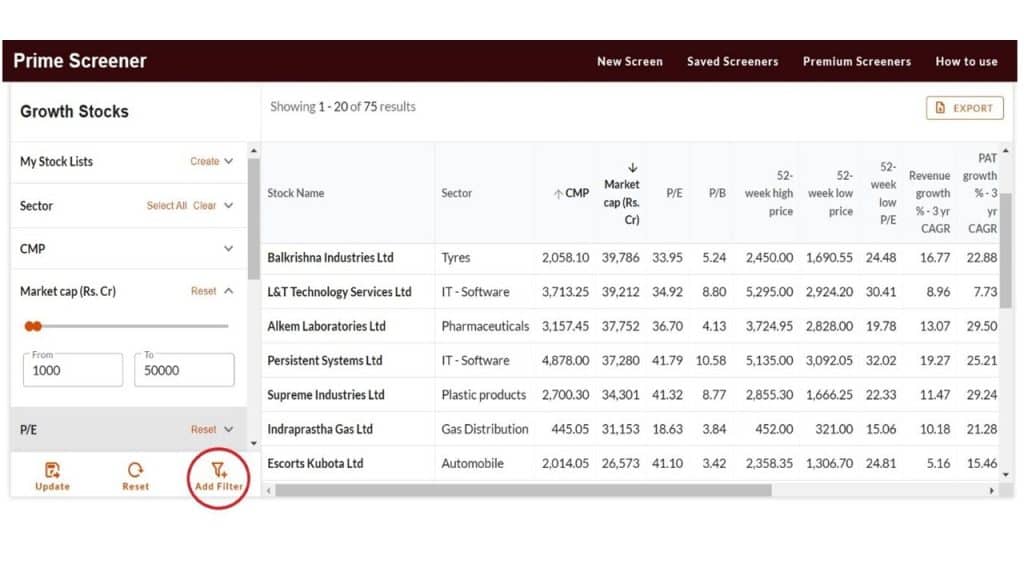
The next step is to narrow this list down. Once you go to the Stock Screener, click on ‘Add Filter’ (circled in red in the image below). There are a few key metrics that you can use to pick stocks that are worth taking a deeper look into.

- Growth filter – Choose Revenue, EBIDTA and PAT Growth filters for 3 years and input the ‘range’ in the left panel. The range is dependent on whether or not we are in a high earnings growth phase in the market in the last few years. Since most sectors have been hit by the pandemic in recent years, and then by both input cost pressures and demand pressures, it’s best to keep the range on the lower side or even at zero.
- Quality filter – First use the debt equity ratio to eliminate high-debt companies; at a time when interest rates are high and input costs are already under pressure, highly leveraged companies are best avoided. Then use parameters like the 3-year RoCE and RoE, and input reasonable figures at a lower range to further pick companies with healthy growth. If you want get even more stringent on quality, then add the cash flow and cash conversion cycle filters; else this can be skipped.
- Valuation filter – Pick the PE or PB ratio and add reasonable valuation ranges; you want to avoid very high or very low PE stocks at this time. You can also use the market Cap to sales ratio to filter out expensive stocks – say those above 10X sales to market cap.
- Ownership – Use this to weed out stocks with low promoter holding or to avoid companies with higher pledging.
You can save this screener, which will appear under “Saved Screens”. You can directly use this any time you need; the output that the screener throws will automatically refresh to show the stocks that meet the criteria at that time. You can be always be sure you have a current list of stocks that meet your criteria.
We ran the above checks on the 900 stock universe. This narrowed our list down to 75 mid-and-smallcap stocks across sectors. You can download this excel of shortlisted stocks here.
You can dig deeper into the stocks you find interesting, from here. To fine-tune the list of metrics further, you can also refer to our earlier explanation on how to find growth stocks using the Stock Screener.
Broader manufacturing opportunities
This is another opportunity that we highlighted in our equity outlook. A report by Bain Capital puts it as a trillion dollar manufacturing exports opportunity for India. The key sectors being highlighted here are chemicals and pharmaceuticals, electronics, automotive, industrial machinery, and textiles. Among these, sectors such as electronics and textiles have very few companies to play the opportunity. The textile export opportunity due to China+1, for example, largely centers around apparel exporters where India already has very a low market share and few quality listed players.
Therefore, there are only a few other sectors that are large enough in terms of listed opportunities that we can explore. We’ll thus look at auto components, industrial goods, and chemicals and pharmaceuticals.
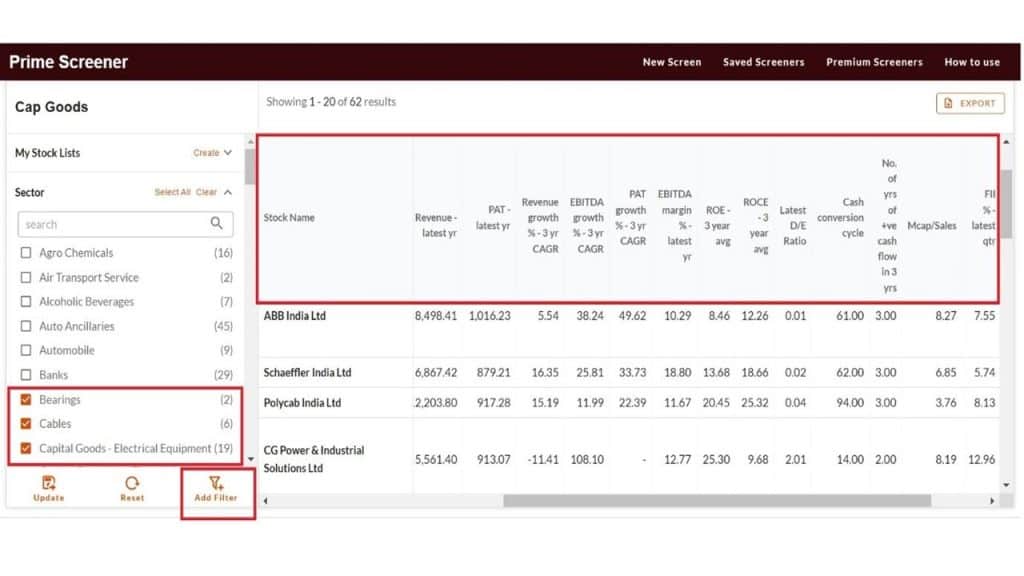
For this, you’ll first need to choose the relevant sector (see image below) and follow that by some preliminary checks to weed out the less-desirable companies in the Stock Screener:
- Set the lower end of the marketcap range to Rs.1,000 crore to avoid micro-caps
- Use “Growth” filter to add data on latest year sales, PAT, 3 year revenue growth, PAT growth, for comparison. You can put the lower end of growth as “zero” in the 3-year data to remove companies without any growth.
- Use quality filters to add RoE, RoCE, debt to equity, cash conversion cycle, for comparison. Fix the lower end of RoE/RoCE band at 10 or 15% for better-quality stocks.
- In valuation filters, add the EV/EBIDTA and marketcap to sales as the former is often used in sectors such as capital goods and industrials. PE and PBV will appear by default in the output.
- Save the screener and download the output. The saved screener can be retrieved anytime and the companies meeting the filter criteria will appear when the saved query is retrieved.

Industrial goods
Sectors to choose here, in the ‘Sectors’ field: Capital goods-electrical, capital goods non-electrical, cables, engineering and electronics. These sectors cover the growth opportunity in industrial goods.
Applying the above filters in our stock screener, you will get 70 companies to compare across various parameters. The moment you change the lower end of revenue, EBIDTA and PAT growth to “zero” (to eliminate those showing no growth in the last 3 years) and modify the lower end of RoE to 10 -15%, the output will suddenly shrink to 35 companies. This effectively gives you a list of stocks that meet fundamental quality checks and which have shown some level of growth. The image below shows some of these 35 stocks. You can then use other filters such as valuations, and then dig further into companies that catch your interest.
A downloadable excel with the full stock list is here.

Quick note: Some of these stocks already are in Prime Stocks; head on there to know which ones we recommend, and to understand how you can analyze the opportunity in the space.
Pharmaceuticals and chemicals
Sectors to choose here, in the ‘Sectors’ field: Chemicals and pharmaceuticals.
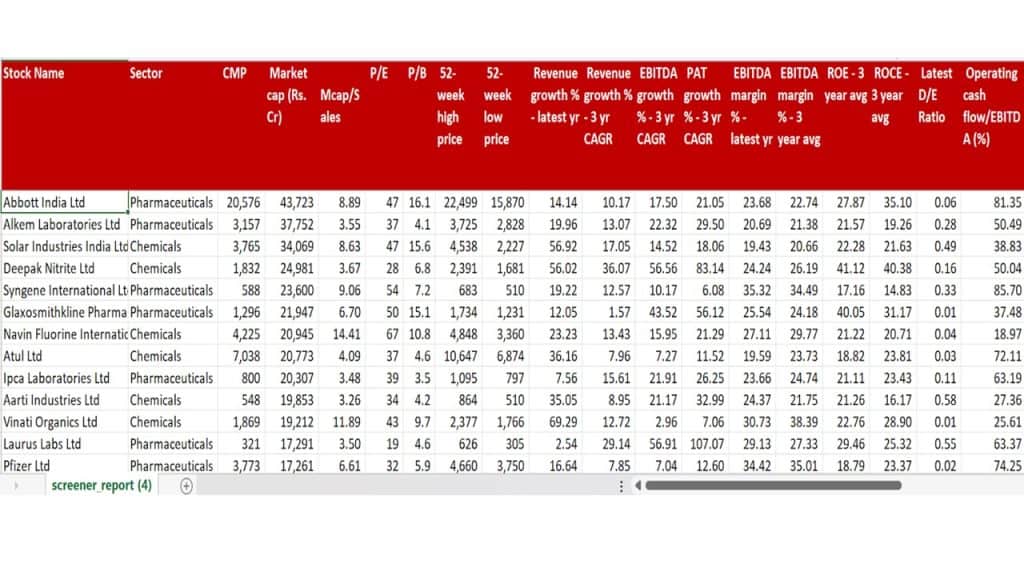
Applying the basic filters explained above will show 118 companies. This will narrow down to 60 if you set the lower end of revenue, EBIDTA and PAT growth to “zero” to weed out companies without any growth in last 3 years and set the lower end of RoE to 10-15%. Given that these are working capital intensive businesses, you can be more stringent on metrics such as debt equity ratio (upper end at 2 or lower) and cash conversion (say, 180 days as there is no merit in looking at a company with a cash conversion cycle beyond that). A sample snapshot of these stocks can be seen in the image below.
A downloadable excel with the full stock list is here.

Auto ancillaries
Sectors to choose here, in the ‘Sectors’ field: Auto ancillaries, bearings, castings & forgings. These are the various sectors that are a play on the auto ancillary theme.
Applying the above filters in the stock screener, you will get 56 companies to compare. They can be further filtered down based on any of the selected parameters by altering their upper and lower range. We have explained this particular segment in detail in our article on 2 ways to pick growth stocks – see the section on ‘Riding a sector’. We will skip getting into detail here.
Other opportunities
As we noted in both the equity outlook and in our other calls over the past few months, earnings growth will now take precedence over all other factors for stocks to move higher. The question then, is how you can identify stocks with earnings growth. Some of our ‘Premium Screeners’ in the Stock Screener will help here. Premium Screeners have in-built criteria that will shortlist stocks. Here are those that will come in use especially now.
Steady earnings growth
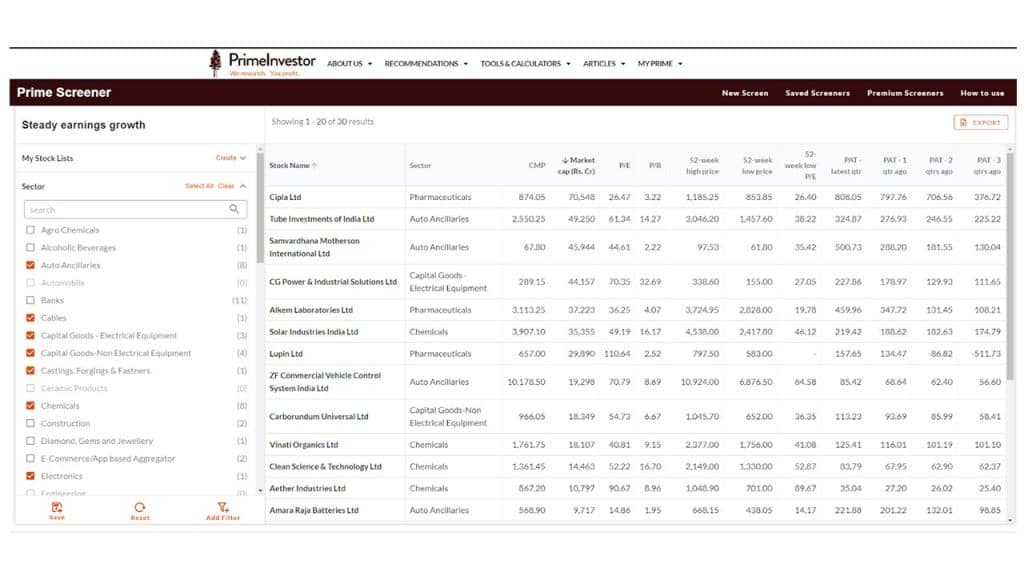
This Premium Screener can be used to identify the short-term earnings trend. Applying this Screener now will show 189 companies with steady earnings growth for last 4 quarters. If you want to further narrow it down, you can use the Sector filter to pick sectors you’re interested in or understand better. You can also apply this screener on the sectors mentioned above. The image below, for example, shows a sample output data of 30 companies with steady earnings growth from the sectors such as industrial goods, auto components, chemicals and pharmaceuticals, which we discussed above. The full list can be downloaded here.

Increasing EBIDTA margins
In a similar way, you can use this premium screener to filter companies that are showing better EBIDTA margins in the latest quarter either quarter-on-quarter (which shows margin recovery) or year-on-year (which shows steady growth in margins). These companies will be the list of those that are currently doing well or are making a comeback in this tough environment.
For more on how to use the various filters and screeners, such as debt reduction, steady cash flow, 52 week highs and lows, you can refer to our earlier article why these 6 prime stock screeners make you an equity pro!


1 thought on “How to pick stocks in 2023”
GOOD MORNING. Very useful data on stocks. thanks.
Now we have to further research and identify stocks for investments.
many thanks,
bala
Comments are closed.