
This is an update to the Nifty 50 outlook that was posted about a month ago. The Nifty 50 index has struggled make headway on the upside and has instead traced a bearish sequence of lower highs and lower lows in the daily chart. As observed in the previous post, the low at 14,500 was the first reference point and the Nifty 50 index has breached this level, which is a cause of concern.
Long-term scenarios
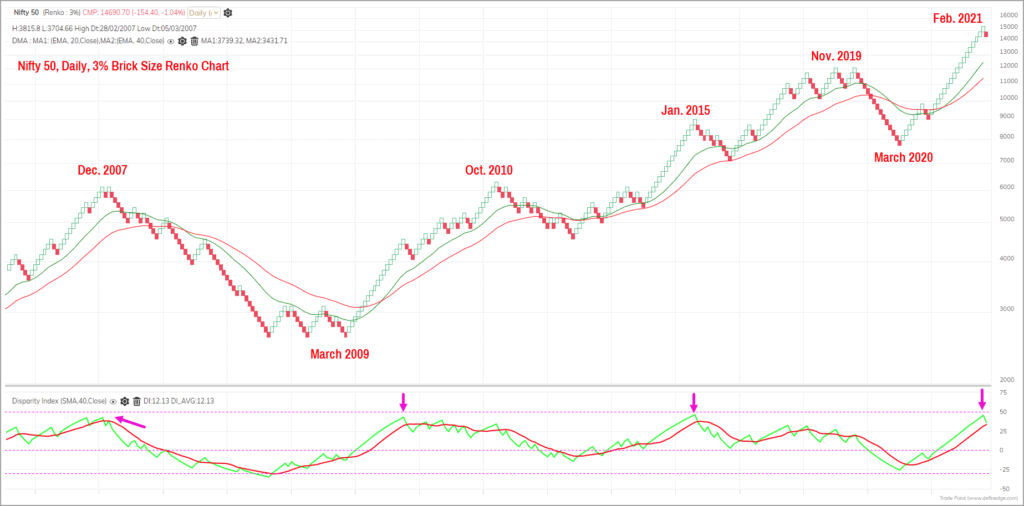
Let us take a look at the current market structure of the Nifty 50 index across multiple time frames to get a holistic picture. Featured below is the Renko chart in the bigger time frame (3% brick size chart) along with the Disparity Index.
As highlighted in the chart above, the Disparity Index has turned down from levels at which it has historically turned around. This indicates that the index is getting ready for a corrective or a cool-off phase. This cool-off in breadth could play out either as a price correction where Nifty 50 could drop to lower levels or as a time correction where the price consolidates in a range. We could see a spike in volatility if a time correction were to play out.
The above 3% Renko chart provides a long-term (8-12 months) picture of the Nifty 50 index.
Short-term scenarios
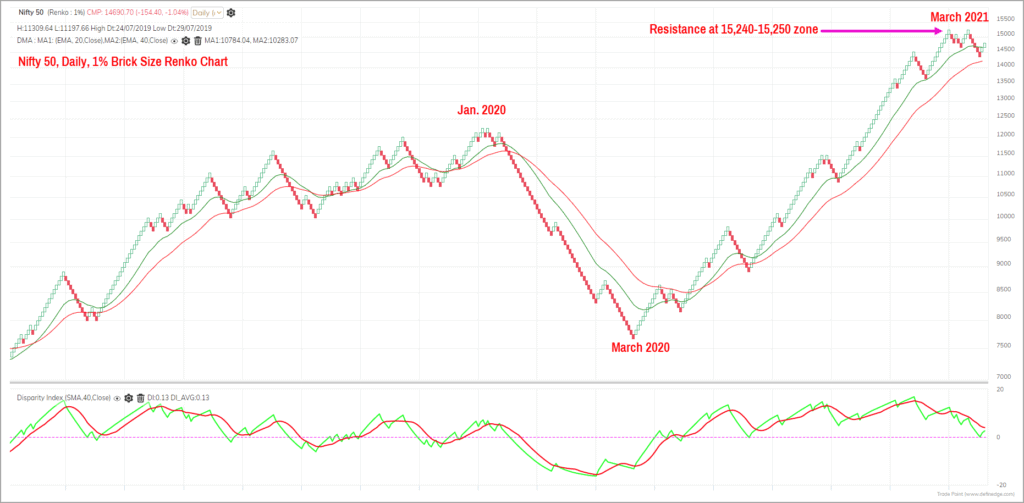
Now let us zoom in and take a closer look at the relative shorter time frame price action. Featured below is the Nifty 50 Renko chart in 1% box size.
The index has formed twin peaks at 15,243 and has since breached the earlier low at 14,500 too. This is a sign of weakness and unless the index goes past 15,243 again there would be a strong case for continued weakness in the short term (8-12 weeks).
What is the short-term target?
The longer time frame, captured by the 3% Renko chart, is suggesting a cool-off and the short-term picture is supportive of this view. The obvious question for most market participants would therefore be:
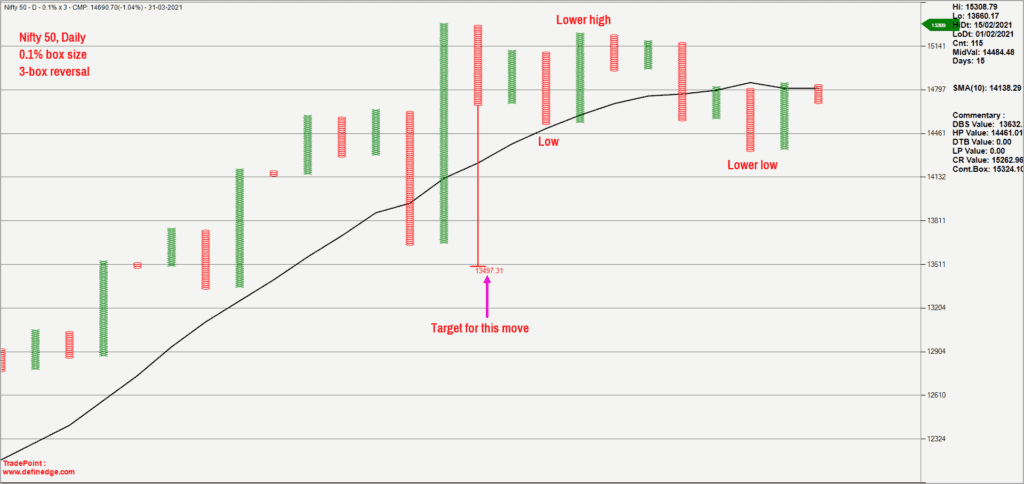
What is the short-term target for the index? The Point & Figure chart of Nifty 50 index featured below addresses this question.
The downside target based on the Point & Figure vertical count methodology works out to 13,500 now. This target would remain valid until the price goes above 15,400. A close below 14,300 would strengthen the case for a slide to 13,500 or lower.
Broader market perspective
Before we wind up, here is a quick look at the outlook for broader markets, which is relevant to most investors who tend to invest outside the index baskets. The Nifty MidSmall cap 400 index is still outperforming the Nifty 50 index. The immediate upside target for this index is 8,980 and medium-term target (4-6 months) is 9,530.
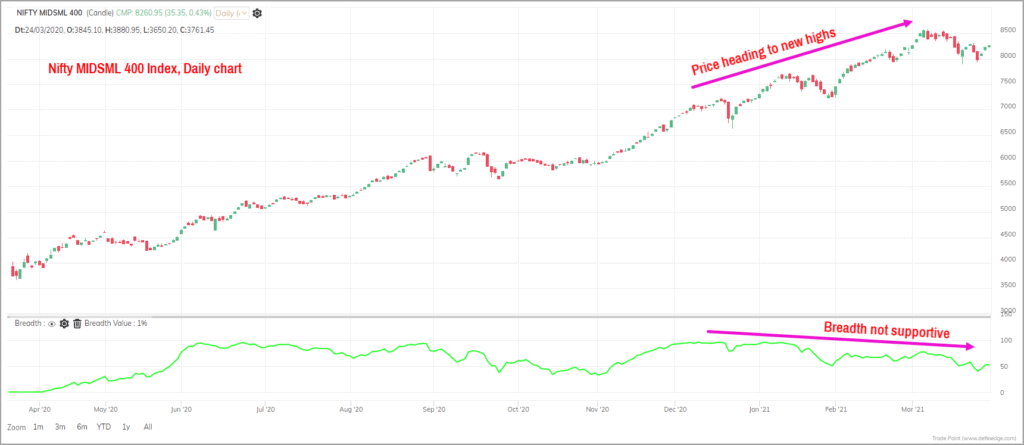
Let us also take a look at the market breadth of this index. The chart featured below captures the daily price action of the MidSmall Cap 400 index along with the percentage of stocks trading above their 50-day moving average displayed in the lower pane.
There is a clear negative divergence between the price action and the participation of stocks that is captured by the market breadth indicator. While the MidSmall 400 index has scaled new highs, the percentage of stocks trading above their 50-day moving average has not kept pace. The market breadth indicator has been drifting lower suggesting fewer stocks are trading above their 50-day moving average, which is not a healthy sign.
The percentage of stocks trading above their 200-day moving average (which is the long-term breadth indicator) is still overbought at 88%. This again suggests the possibility of a correction or cool off.
The market breadth of broader market is displaying signs of weakness, even a there are open upside targets for Nifty MidSmall 400 index. Given this scenario, it is advisable to wait for concrete signs of the Nifty 50 resuming its uptrend before increasing exposure to the equity asset class even if one is focused on broader markets.
Preferred Nifty 50 outlook
The price action in Nifty 50 index has turned volatile and suggests the possibility of a further drift lower. Though the broader market is relatively better placed compared to Nifty 50 index, the short-term breadth (measured by percentage of stocks trading above 50-day moving average) is displaying negative divergence.
- So the base case scenario is that the Nifty 50 index is likely to drift to short-term target of 13,500.
- The disparity index in the bigger time frame is turning lower from overbought zone, suggesting the scope for a time or price correction.
- As long as the recent highs of 15,400 are not violated, we would remain bearish on the Nifty 50.
- As always, have an exit plan and stick to it.
- Do not tamper with your regular SIPs based on the observations in this post.
Here are a few suggestions to deal with the scenario
- Do not aggressively increase your equity exposures at the current levels as the market breadth and short-term outlook (6-8 weeks) are not supportive of a further rally.
- We will share an update either on a close past 15,400 or on a fall below 13,500.
- Have a clearly defined exit plan for your existing equity holdings and more importantly stick to it.
- Exits are underrated and the quality of your exits influence the return on investment.



12 thoughts on “Nifty 50 outlook: Struggling index hints at correction”
Kindly provide an update as the index has crossed 15500
Hello:
We will come up with an update in a couple of days.
Regards
B.Krishnakumar
Looking at today’s record closure of nifty at 15337, all your theories of correction to 14k and sub 14k is out of the window, I assume. I was looking forward to the correction and planned the investments accordingly….as the saying goes, ‘corrections come, when you expect it least’……..I am looking forward to revised revisions of upward journey of nifty now
Hello:
Let us give it a few days for the price to settle down. We will soon come out with an update to the Nifty outlook. As I always say, have an exit plan and stick to it.
Thanks
B.Krishnakumar
As usual crisp and clear and the boundary is marked. Time to look for opportunities outside of Nifty 50.
One recommendation is to link these posts which would enable a continuation for readers to comprehend as well
Regards
Madhavan
Dear Krishnakumar, I find your articles very purposeful (quite certainly this too is) & has helped me take a decision quite well too. Though I don’t understand the technical words that you use, I can decipher (assuming so) the sense well. Thanks a bunch to you & your enablers.
I like this reiterative note from you: “Exits are underrated and …. ”
Merci
Hello Arun:
Thanks for the feedback. Glad to know that you found the posts informative. There is a popular quote that “Entries are optional but exits are mandatory”. And it is the quality of your exits that influences your returns. And most of us are aware of the story of Abimanyu in Mahabharat who was killed because he did not aware of the exit from Chakravyuh.
Regards
B.Krishnakumar
V useful article.
Prime Investor should consider starting a full fledged financial advisory!
Useful and clear article, thanks
I would be like to know what would be best hedging strategy to protect my stock portfolio for downward protection from this index level. Say I have a portfolio of stocks worth 50 lakhs. If it is buying nifty put option, then what levels and qty of PUT option and what timeframe, I should buy ? This is just from pure insurance intention of downward protection of stock portfolio.
Hello:
Please consult your Financial Adviser or Consultant regarding portfolio hedging. Remember, hedging is like buying term insurance. It has a cost associated and would prove beneficial if you consider taking such hedge regularly, based on some well defined criteria.
Regards
B.Krishnakmar
Thanks, I am looking some criteria as mentioned and it can generic …some sort of option and approach for the option. This can be beneficial for entire community.
Comments are closed.