In the previous update that we published on the possible levels for the Nifty 50, we expected a retest of June lows. This, however, did not play out. Contrary to expectations, the index marched higher, a gain that even managed to break the then-mentioned upper reference level 16,800. Interestingly, the downside trigger level of 15,350 was not even challenged!
So, now that the upper reference level has been breached, the key question is – what can you expect from the Nifty 50? To address this question, let us study the charts and focus only on the short-term perspective.
I am not addressing the larger question of whether the June low of 15,183 is the major low for the Nifty 50 index. The answer to this would become a bit clearer based on how the Nifty 50 behaves in the next few weeks. As always, we shall come up with a medium to long term update on Nifty when we have that clarity.

Overbought zone?
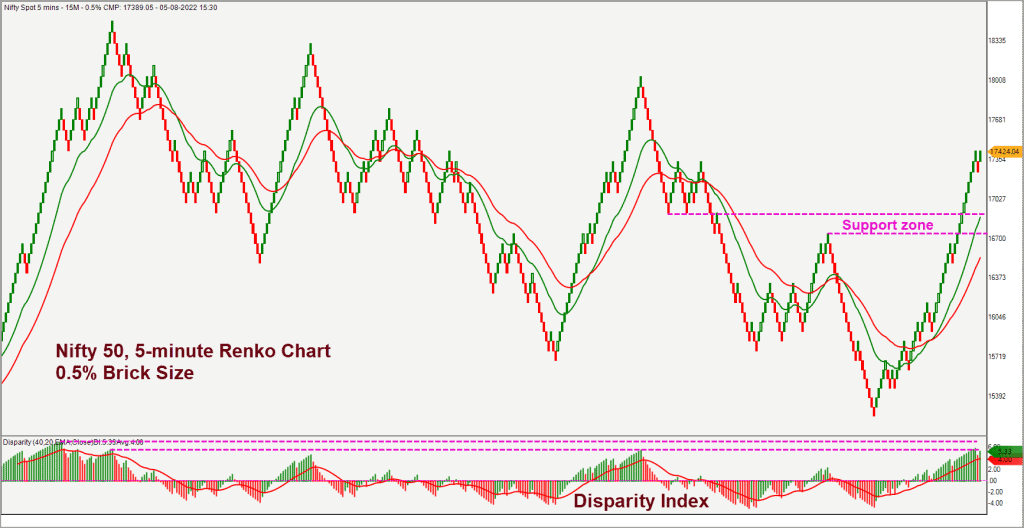
For now, let us focus on the short-term outlook, valid for the next 2-6 weeks. Let us get started with the Renko Chart of Nifty 50 in a 5-min time frame, using a 0.5% brick size. Here is the chart.

The Disparity Index indicator is plotted in the lower pane in the above chart. This indicator captures the distance between the price and the red coloured 40-brick moving average, also plotted in the chart above. The Disparity index is currently at levels from which price has historically turned lower. In essence, the Disparity Index is suggesting that the recent rally has pushed the price to an overbought zone and supports the case for a short-term correction.
Let us also take a look at the short-term and medium-term breadth indicators to check if they corroborate this view based on the price chart. The PF-X% indicator is the tool of choice for us to study market breadth. The PF-X% indicator captures the percentage of stocks that are in a bullish swing in the Point & Figure chart. To study the short-term breadth, we use the PF-X% indicator in the 1% box size Point & Figure chart.
This indicator in 1% box size is currently at 84%, suggesting extreme overbought condition. Typically, the scope for sustained rally in Nifty 50 index would be limited when the breadth reaches overbought extreme.
The more interesting aspect is the positioning of this breadth indicator in the medium-term time frame.
In the 3% box size Point & Figure chart, the PF-X% breadth indicator is also at an overbought level of 86% – which again is a cause of concern for the bullish camp. The short-term price action indicates an overbought condition and the breadth indicator in the short and medium-term time frames are also overbought. This scenario is ideal for a consolidation or a short-term reversal in the Nifty 50.
The immediate downside target for the Nifty is 16,750-16,900 zone. The possibility of a slide to this target will be strengthened if the price drops below 17,200.
At this time, we do not have a clear-cut answer to questions such as:
- Has the Nifty bottomed out?
- What is the upside potential or medium-term downside target for Nifty?
The nature of the anticipated pull-back and the way the price unfolds in the short-term will help get clarity on the above aspects.
For now, there is a strong case for a short-term pull back in the Nifty 50 index. If you are a short-term trader and holding long positions, it would be advisable to tighten up your stop loss or have a clearly defined exit plan that needs to be executed.
Avoid fresh aggressive exposures in Nifty 50 index as the risk-reward is not too favourable in the current scenario. Your long-term SIPs and other investments can remain undisturbed.
We will come up with a more detailed note, after a few weeks, on the medium-term outlook and also address the key question of whether the worst is over for the Nifty 50 index.
Sector outlooks
Before we wind up, there are few sectors that are showing relative outperformance. The auto and FMCG sectors are the ones that are showing consistent relative strength versus Nifty 50. Any dip would be a buying opportunity in these sectors.
The Nifty Metal & Nifty IT indexes are displaying early signs of promise. But I would prefer to wait it out for a week or two before taking any exposure in metal stocks. Both these sectors are showing a lot of promise after a sharp fall. Even so, it makes more sense to wait for strong evidence of relative outperformance versus Nifty 50. We shall update the status of these two sectors if there is convincing improvement in performance and relative strength.
The Nifty MidSmallCap 400 index is looking much better compared to what it was when we published the previous update in July. The breadth indicator for the broader market has improved remarkably, suggesting that the recent bullishness in the Nifty 50 index has rubbed off positively to the broader markets as well.
Long-term investors can use any short-term weakness to consider increasing exposure in the mid small-cap space via the mutual fund route.


4 thoughts on “Technical outlook: What can you expect from the Nifty 50?”
In stock ranking section. The higher the score
in each of group like Growth/quality/valuation betterr is the stock. Is my understanding right
Right sir.
Hello, Good Morning. I wanted to subscribe PrimeInvestor, your rate says Rs.5000/ for one year of digital publication, but when I actually wanted to pay, it asked me to pay $100/ I am in Dubai.
Why there is a difference between what you advertise and what it is actually even for a digital subscription? Written twice & as usual, no response yet.
Tapash Bhattacharjee
Thank you for your interest in our subscription. We have responded both times to the query you have raised with an explanation. Request you to please check your email or spam folder. – thanks, Bhavana
Comments are closed.