![]() In our previous update on the outlook for the Nifty 50, we had mentioned that the short-term outlook was positive but the price has to cross above the resistance at 17,600 for the bullish scenario to play out. The Nifty 50 was unable to clear this resistance and was rejected from this level. The index then recorded a low of 16,410 on December 20 although it has since recovered.
In our previous update on the outlook for the Nifty 50, we had mentioned that the short-term outlook was positive but the price has to cross above the resistance at 17,600 for the bullish scenario to play out. The Nifty 50 was unable to clear this resistance and was rejected from this level. The index then recorded a low of 16,410 on December 20 although it has since recovered.
Therefore, let’s take a look at whether the short-term outlook for Nifty 50 holds or has changed.
Nifty 50 – short-term view
We are not discussing the Nifty 50’s long-term outlook as there is no change in our view compared to what was shared in the previous update. Therefore, we’ll stick to the short-term view. To study this outlook, we shall use the 1% brick size Renko chart. Have a look at the chart displayed below.
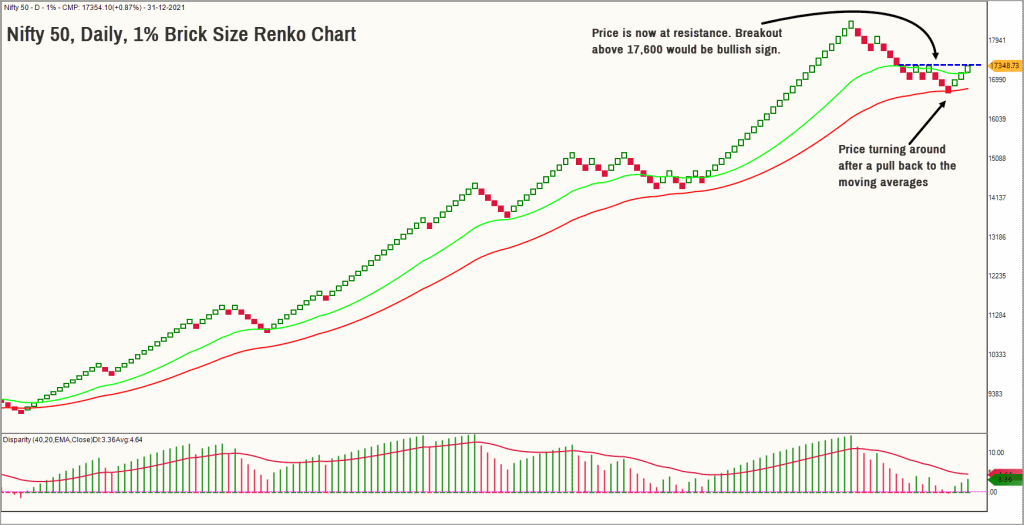
If you notice, the price has pulled back to and bounced from the moving average, which is a positive sign. The market breadth indicator measured by PF-X% has recovered along with the recovery in the price from the December 20 lows. The PF-X% indicator captures the percentage of stocks that are in a bullish swing in the Point & Figure chart.
The PF-X% breadth indicator in 1% box-size is currently in the overbought zone at 80%, suggesting the possibility of a short-term cool off or consolidation in price. But this breadth indicator has improved from the oversold level of 16% on December 20. The recovery in price backed by the recovery in breath is a healthy sign suggesting widespread participation of the stocks from the Nifty 50 universe.
Things are getting more interesting now. The Nifty 50 index is at crossroads in terms of price action and breadth.
The recent price rebound has pushed the Nifty 50 index closer to the earlier-mentioned resistance level at 17,600. A breakout above 17,600 holds the key to short-term outlook. Should the index push through this level, it would be a positive signal. The Nifty 50 could then head towards 18,000-18,300 and may even challenge the prior highs at 18,600.
In the extreme short-term (read as 4-10 days), there is a case for a consolidation or cool off in price owing to overbought breadth condition (as mentioned above) and price heading towards the resistance zone. As long as the recent swing low of 16,400 is not breached, we can work on the assumption that the price could head to 18,000 or even to 18,600.
While that’s for the Nifty 50 outlook, there’s also a lot to be said about sector-specific indices. So, let’s take a quick look at a few interesting sectors that are worth focusing on and the ones to avoid.
Nifty IT: Among the best sectors
The Nifty IT Index is by far the best sectoral index both from a price pattern perspective and relative performance basis. Have a look at the chart displayed below.
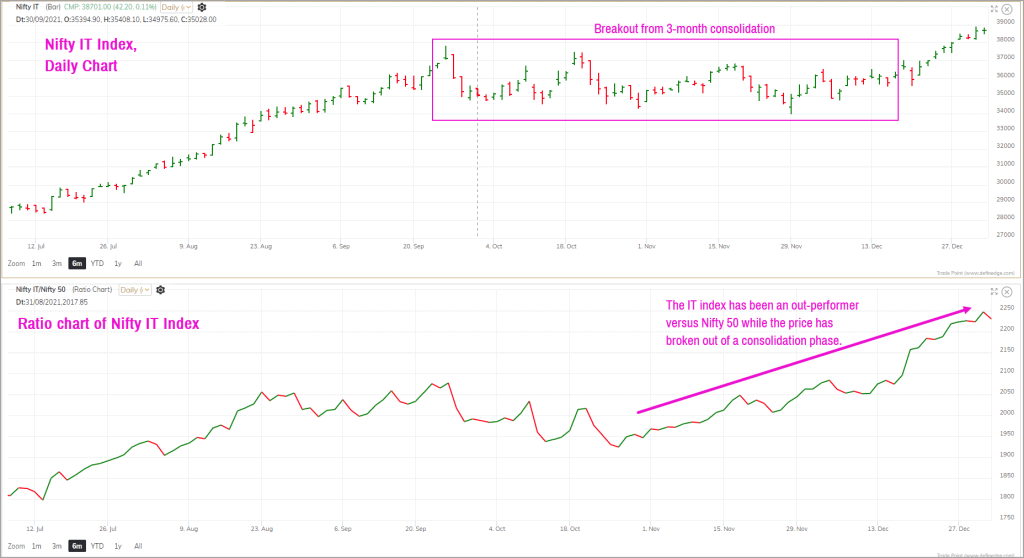
As highlighted in the above chart, the Nifty IT index has broken out of a 3-month consolidation and is trading at lifetime highs – among the few indices that are doing so – which is a positive sign. Along with the breakout in price, the relative performance of this index has also improved in relation to the Nifty 50 index.
The short-term outlook is positive, and this index could head to the next target in the 41,100-41,500 range. A close below 34,000 would be a sign of weakness. Until this level is breached, the outlook for the sector would remain bullish.
Nifty Pharma: Green shoots visible
The Nifty Pharma index has been among the underperformers for several months now. However, the recent price action is interesting with the price turning around from support levels. What is even more interesting is that the relative performance of the index is improving versus the Nifty 50 index in the past few days. The sector breadth too has improved.
Given this backdrop, Nifty Pharma could be an interesting sector to watch from a 3 to 6-month perspective. Remember, these are just green shoots, and we need more confirmation in terms of upside momentum in the price action and more importantly, a sustained improvement in the relative performance versus Nifty 50.
Based on the vertical count method in the Point & Figure chart, the target of Nifty Pharma index works out to 16,300-16,500. A move past 14,850 would strengthen the case for a rise to these targets. The bullish view would be invalidated below 13,200.
Nifty Bank: The sore spot
The Nifty Bank index is a proxy for overall economic health and the banking stocks have significant weightage in the Nifty 50 index. Given this, the index assumes a pivotal role in influencing the price action in the Nifty 50 index. It is essential that this index picks up steam to impart upside momentum to the Nifty 50.
Unfortunately, the Nifty Bank index has turned weak recently and has additionally been a consistent underperformer versus Nifty 50 since February 2021. Yes, the Nifty 50 index can move higher despite relative underperformance from Nifty Bank index. But if the Nifty Bank index were to outperform, it could have a bigger positive rub-off on the Nifty 50 index.
A move above 37,500 could lend upside momentum to the Nifty Bank index. For now, it would be better to stay light with respect to this sector. Consider fresh exposures if the index closes above 37,500.
Nifty Metals: Will it regain its sheen?
The Nifty Metals sector was a top performer in the first half of calendar year 2021. It has since lost its sheen in the past few months with price getting into a consolidation zone. The Nifty Metal Index has turned a relative underperformer since July 2021.
If the index needs to reinstate 2021’s bullishness, the Nifty Metal must move past the resistance level at 5,850. While there is a possibility of a rally to 6,500-6,800, it would make sense to wait for some evidence of upside momentum before taking exposure to this sector.
For now, keep this sector in your watchlist.
And finally, as we always say, stick to your regular SIPs and do not fiddle with it. If you have a cash portfolio and an exit plan, then just stick to it.



7 thoughts on “Technical outlook: Short-term outlook for Nifty 50 & key sectors”
Well – 17,600 has been breached today itself – and that too comprehensively and with good volumes.
Hello:
Yes, 17,600 was breached and the index appears on course to head to the targets mentioned in the copy.
Thanks
B.Krishnakumar
Very nice and informative article. Your previous article was spot on, wrt nifty . Hope this also plays out as you have predicted. Is there any article on ‘ how to make an exit plan’ for non goal related investments?
Hello:
Appreciate your feedback. I am a technical analyst and my exit plan is based on the price action alone. A very simple exit plan for non-full-time investors could be a close below the 200-Day moving average. You can choose to exit when the stock you hold closes below the 200-day moving average. There are numerous free websites that help you plot the chart with 200-day moving average. We can add layers of complexity or filters but that is not for everyone.
Hope this helps.
Thanks
B.Krishnakumar
Thanks
New Year 2022 Greeting PrimeInvestor Team,
This article, ” Short-term outlook for the Nifty 50 & other sectors” is again one of the best articles and helping us for financial literacy . But my suggestion is to make this article even more simple version.
Regards
Sridharan R
Hello:
Glad that you find these articles informative. We are consciously trying make these posts jargon-free and convey the view in a simple language. But, your message suggests otherwise. Request you to highlight specific instances where you are struggling to understand what is being written in the post. That will help us implement the necessary changes.
Regards
B.Krishnakumar
Comments are closed.