Introducing Prime MF Screener – a research screener that empowers you like no other MF retail research tool in India. Prime MF Screener is a research tool that will help you screen mutual funds using key performance parameters as well as portfolio parameters. The end objective can be to either choose funds for investing, to make decisions on exiting or simply review performance and quality of your funds vis-à-vis peers/benchmark.
Before we discuss further, here are the key links for you to refer and use as a guide to navigate through the MF Screener.
- You can access Prime MF Screener here
- You can read about how to use our filters here
- You can learn how to use the basic and advanced screens here
Why a Mutual fund Screener?
When we started PrimeInvestor, our desire – or mission if you call it – was to empower all of you with unbiased research and researched solutions that is simple, that has no agenda driving it and is accessible.
We started by providing researched solutions – recommendations, portfolios, MF review tool and ratings. We added several tools and recommendations for other products as well.
We soon gathered the following through our engagement with you:
- that many of you are discerning investors (as DIY investors) and wished to verify facts, crunch numbers and come to your own conclusion, or at least try to understand what we do to arrive at our output.
- many of you were constrained by data availability and used point-to-point data to arrive at your investment decisions.
- some of you felt handicapped to cross verify if the choice/quality of funds given by your advisor/distributor is right.
Since it is not easy for us to write reams about every single aspect of research, we thought we should simply peel off the research veil and arm you with much of the researched data we use (I say much because there is more scope and the rest is further quality research), in a form that easily equips you to handle it to make informed decisions yourself. With some effort, that is 😊
This screener is ideal for discerning investors and any investor who wants to learn how to analyse mutual funds.
With the Prime MF Screener, you will now actually be able to do some of the things we keep repeating when we engage with you:
- Look for risk-adjusted returns
- Look for consistency of fund (proportion of outperformance over peers or category)
- Look for volatility
- Look for worst performance
- Look for rolling average performance
- Look at exposure to debt papers
- Look for large or midcap exposure in the case of equity or look for nature of papers in the case of debt when you compare underlying portfolio quality
And many such data-driven analysis.
An important point to note here is that this is not a tool that gives you every kind of data – relevant or irrelevant – to a category. We try, as much as possible, to keep your choices limited, help you use the most appropriate metrics for different categories, and leave out the rest. This also means we do not load you with every metric possible to calculate, here. We keep it simple! (Somewhat!)
Even if you are not a DIY investor and have an advisor, this tool will give you the ability to know if the options give to you are fine. And importantly, you can look at the expense ratio differentials across the fund categories in one shot to know if your distributor has given you a relatively low-cost fund or otherwise.
Let us move on to what the MF screener broadly tries to capture before summing up on how to use it.
What the Prime Mutual Fund Screener has
Let us try to capture the various parts to the screener for you to get a hang on how to use them. You can also watch the recording of our live session on December 22, 2021 to watch a demo on how best to use it.
#1 Default page
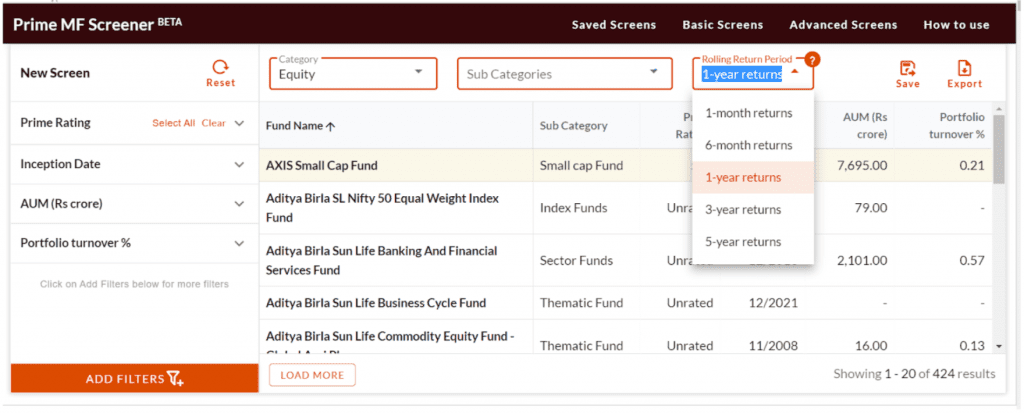
There is a default page as you can see in the image below with 3 columns (that can be filtered as seen in the left tab). Post January 1, unless you are a Growth member and are logged in, these will be the only fields you will be able to see. You will be unable to use any of the filters.
#2 Inputs needed before using filter
The image above shows you an orange button called Add Filters. Before you use them, you need to set some key criteria. At the top middle of the image above, you will see three dropdowns – Category, Sub-categories and Rolling returns period. These act as the base for any performance or portfolio filter that you decide to use. That means you need to first choose them before using the performance or portfolio filters.
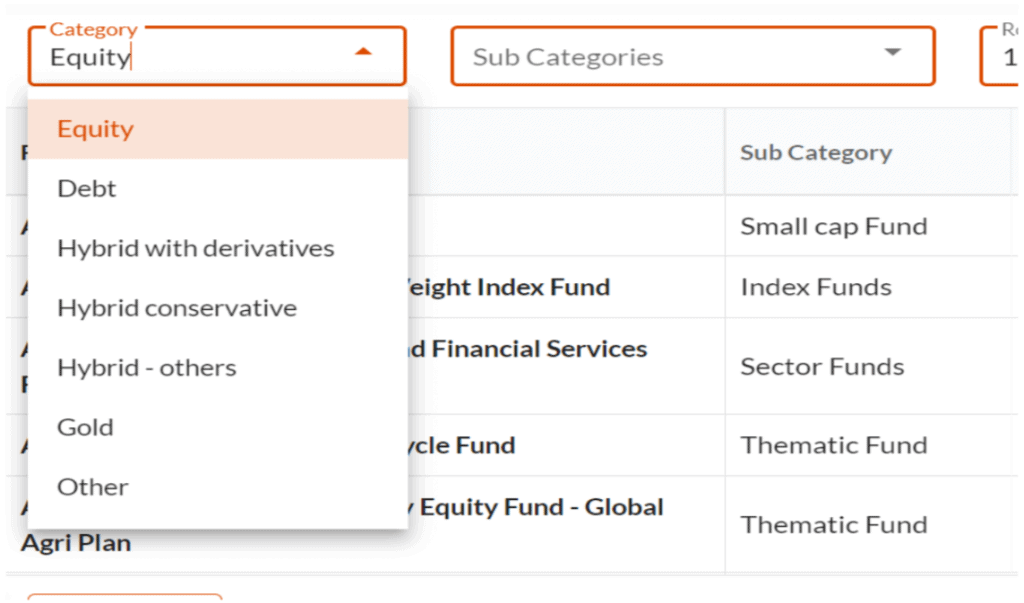
- Category input: These are not SEBI-defined categories. They are categories that help you filter common fund sets and give you data (on performance and portfolio) that is unique to that set. The image below shows you the various categories. We have tried to classify hybrids as ones that hold derivatives (equity savings, arbitrage, balanced advantage and dynamic asset allocation), conservative hybrids and other hybrids. Since the research parameters are different across these sets, you can choose only one set at a time – either equity or debt or gold and so on.
- Sub-categories input: The sub-categories allow you to choose one or more sets within a Category. For example, in the image below, under the Debt category, you have various debt fund options. Here, you can choose multiple sub-categories. For example, if you are looking for debt funds for 3 months to say 1 year, then ultra-short, money market and low duration can be grouped together.
Watch the recording of our live discussion on the MF Screener of December 22, 2021 at 7 pm to know how you can group categories and what sort of rolling returns to use.
- Rolling return period input: This will form the basis for any performance analysis you do with the ‘Performance Filters’. In the very first image above, you will see the rolling return periods in the drop down.
(You can check more about what rolling returns are and why this is a superior way to assess performance compared with point-to-point returns in our earlier article).You can see 1 month, 6 months, 1 year, 3 years and 5 years in the drop down. You can pick one of these. For the period you pick, returns will be rolled daily for the chosen period (1 or 3 or 5 years etc.). Every parameter you pick as filter – Sharpe or rolling return average or percentage of outperformance or standard deviation etc – will be calculated for the period you have chosen.
How do you decide what period to choose? It is simple. For example, for shorter term products like say liquid, arbitrage or even equity savings you can choose 1-month rolling or 6 months rolling. For longer term like equity, it can be 1, 3 and 5 years to get insights into performance over the short and longer term. Again, look out for more inputs on this in our live session.
#3 Using the filters in Prime MF screener
You will find the following filters in the below categories:
You can add as many filters as you want from the above filter groups and you will see a column being added every time you do so. For ease of use, we recommend downloading the data when you analyse.
Let us get into details of the broad filters now.
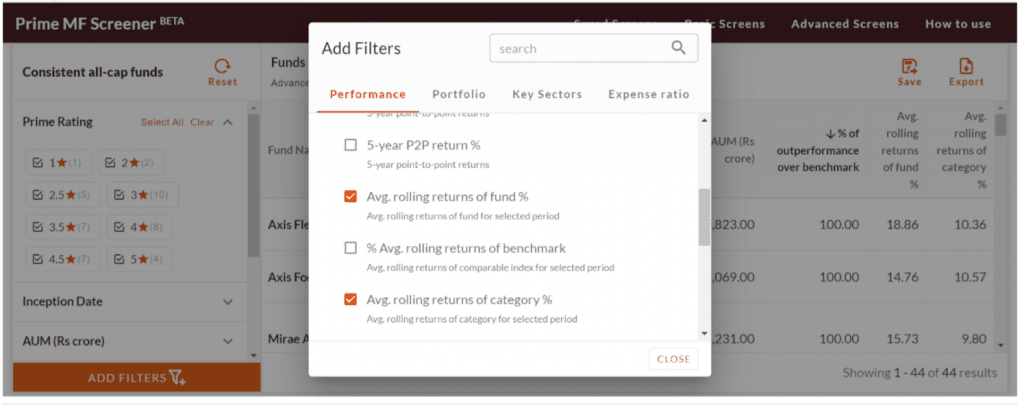
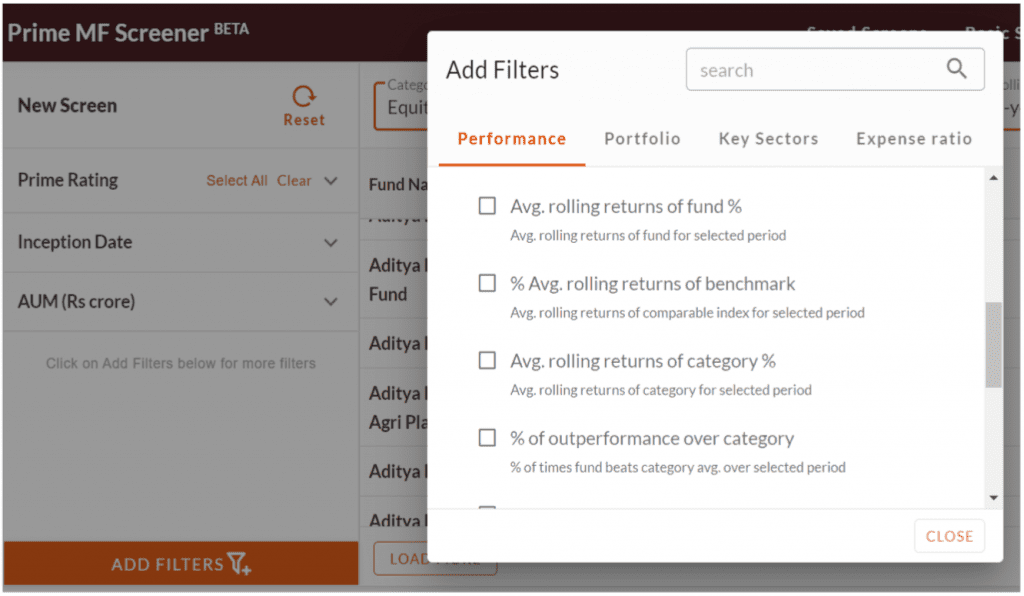
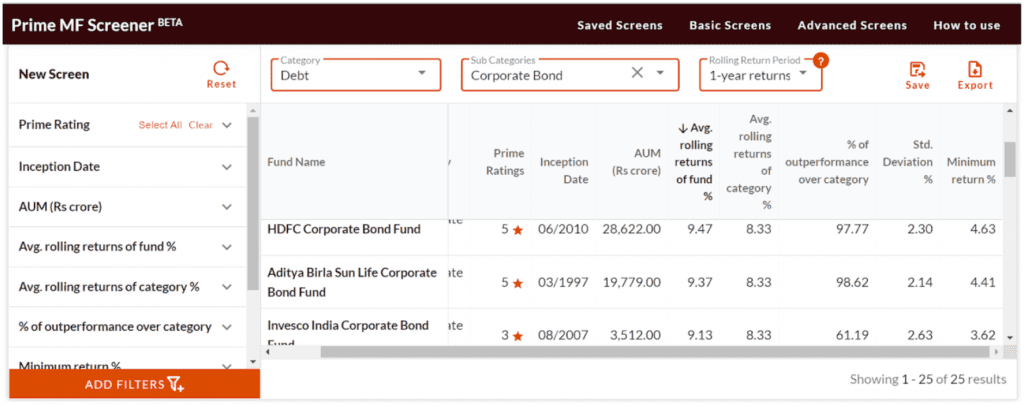
- Performance filter: This filter gives you key parameters that you can use to analyse funds. The image below, for example, gives you the performance metrics for equity funds. Some of these data such as rolling returns average, or outperformance over benchmark or category are research data that are either not available at all or not available in a comparable form elsewhere. This makes this Screener a unique one in the Indian context. To ensure that fewer instances of data (for funds with limited track record) does not mislead your analysis or conclusions, we have laid out the minimum instances of rolling returns required to display performance parameters. If the rolling returns data for any fund falls short of this, performance parameters dependent on rolling returns would be shown as blank. The number of instances needed is mentioned in the MF screener page, as part of the content below the table.
In the image below you will see a screener on debt – corporate bonds using rolling 1-year returns as a base. In the output you will see the average returns of some of the top funds like ABSL Corporate Bond or HDFC Corporate Bond versus the category average and the very high % of outperformance they have shown over category (based on rolling return). If you compare across funds, you will also see that their standard deviation and worst returns (min. returns) fare better than peers. This is just an illustration of how you can mix the metrics to do your analysis.
The performance metrics in debt and hybrid and other categories can vary when compared with the equity performance metrics. We have tried to bring only those metrics most relevant to analysing each category or sometimes sub-category. For example, the question of outperformance of benchmark does not arise in index funds. Here, we give more relevant data such as tracking error, for index funds.
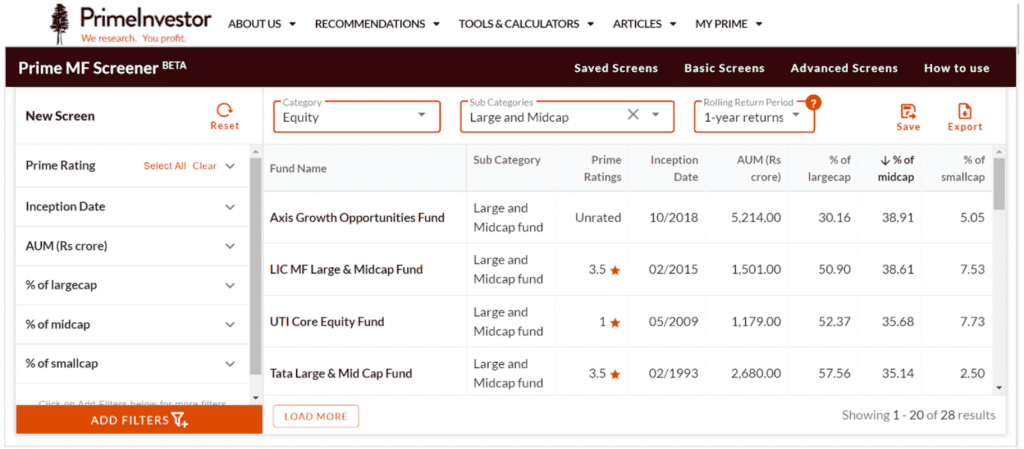
- Portfolio filter: This filter is mighty useful as it provides a single view into the portfolio makeup of many funds, at a time. While you would have seen the % of large-cap or midcap allocation in a fund as part of fund details in some rating websites, this screener makes it easy for you to compare it in a single data extract and thus allows you to make useful conclusions.
To give you an example, let’s say you want to see the more aggressive funds in the Large & Midcap category. The image below gives you the latest exposure of large & mid cap funds to large, mid, and small cap stocks. Sorting it by midcap exposure, you will see Axis Growth Opportunities holding the highest midcap exposure. What does it suggest? That the fund is aggressive in this category. If the fund delivered high returns, it was not without risk.
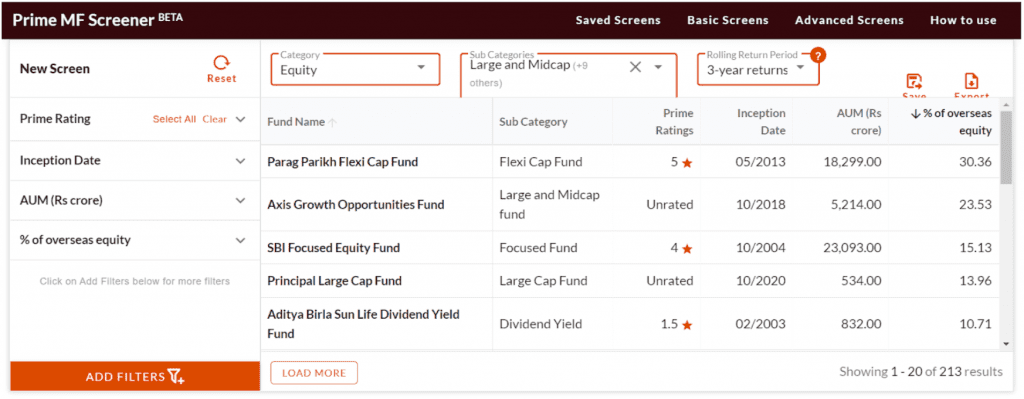
Or you could use this filter for a very different purpose of screening funds that have exposure to, say, overseas stocks (outside of international funds). For example, in the screener below, I have chosen equity funds that are not international or sector funds and used the % overseas exposure filter. Apart from screening such funds, these parameters also give insights into why a fund performed well (say if overseas markets did well or midcaps outperform) or did not deliver.
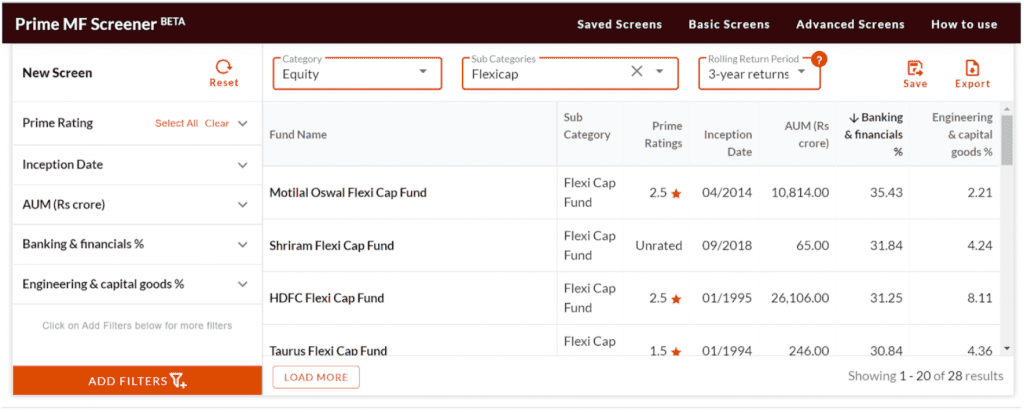
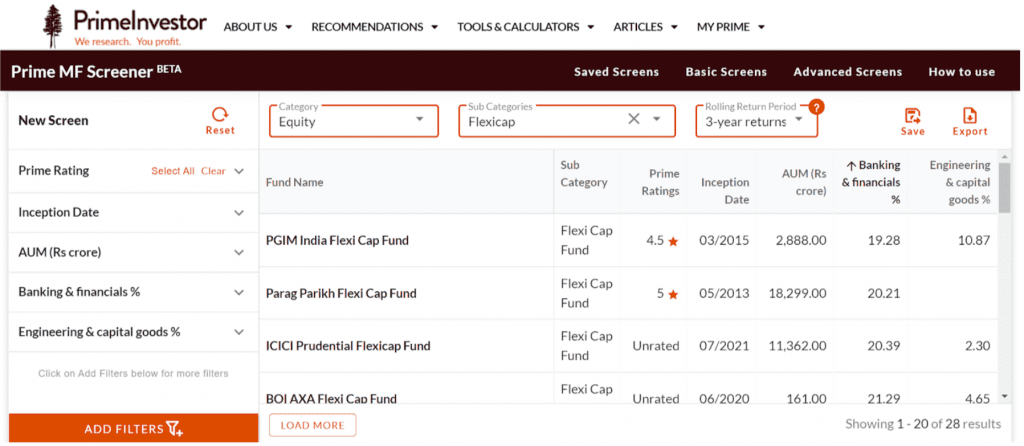
- Key Sectors: This filter is not meant to give you all sector exposure. Rather, we have taken a few key sectors that can typically turn performance in a fund’s portfolio and given the funds’ latest exposure in them. For example, if you feel most funds have high exposure to banking & financials and want to consciously keep it low in, say, a flexi cap fund you are looking for, you could use the sector screener to look at banking exposure (you can add various performance metrics along with this, of course). In the 2 images below, you will see that Motilal Oswal Flexicap has the highest exposure to financials in the flexicap space, while PGIM or Parag Parikh Flexi Cap have the least. Of course, it is important to keep in mind that fund positions in these sectors can change.
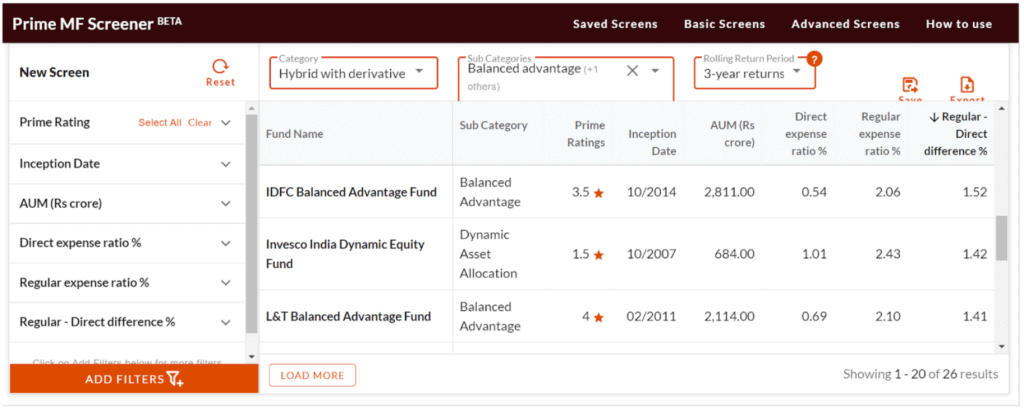
- Expense ratio: This parameter is useful in 2 ways: one, it allows you to add the expense ratio of the list of funds you are filtering – regular or direct and compare them with the category’s average (you can do this in an excel sheet). Two, and very importantly, if you are a regular plan investor, it will tell you how much more you are paying for it over direct plans. For example, in the image below we have balanced advantage and dynamic asset allocation plans. You will see that IDFC Balanced Advantage has a higher differential than say L&T Balanced Advantage.
Ready-made screeners
In the default screen you will see two options at the top called Basic Screens and Advanced Screens. Basic screens simply give you an idea on how to mix and match various filters if you are not familiar with them. They are a starter set of filters that help you begin to use the Screener and understand what it shows about funds. Advanced Screens on the other hand go one step further to reduce the size of your universe by using predefined filters.
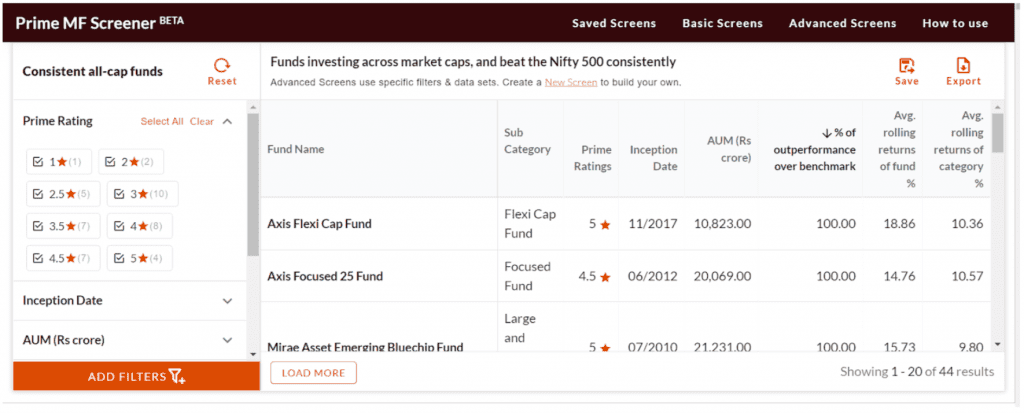
To give you an example: when we use the Screener ‘Consistent all-cap funds’ in Advanced Screen, we get the result below. It shows funds that invest across market cap that are most consistent in beating the Nifty 500. Here, the universe is filtered to show only those funds whose % of outperformance is above category average.
You can add further filters to the advanced and basic screeners to do your own fine-tuning or sifting. For example, you could add more portfolio data to the above screener that has performance to know funds with higher large caps or midcaps.
Please read our detailed article on how to use Basic and Advanced Screeners here.
How should you use Prime MF Screener?
- Prime MF Screener is a great way to compare funds – on returns, ability to beat benchmark and/or peers, on portfolio concentration, risks and more. Understand how good or bad a fund is in comparison to peers, and look at key portfolio data to understand where performance comes from.
- Use it to shortlist funds that are worth looking into further for new investments - based on funds you already hold, the strategy they follow and more.
- Use it to check on your own funds – how they have returned and whether they have kept up with peers or markets.
- Use the Basic Screens if you want to know how to mix some of the filters and use Advanced Screens if you want a predefined goal – like aggressive equity funds or low risk hybrid funds and so on. You have about 12 such options currently.
- Save preferred filters for easy access the next time you log on. Export data into Excel to slice and dice the data to arrive at your conclusions.
Although often compared with media houses (we are far from one) for content, at PrimeInvestor our aim is to provide you with a product platform that you can come to, both for your own research purpose or when you simply need ready solutions. Our MF Screener is built with the former in mind. In this process, if we equip you well and we also learn from you, we are only too happy!
Because an MF screening tool such as this is unique and hasn’t been done before, this article is to explain the concept behind Prime MF Screener and the basics on how to use it. We will be gradually explaining more nuances on using the screener over other articles. So go start using the Prime MF screener and let us know what you think!
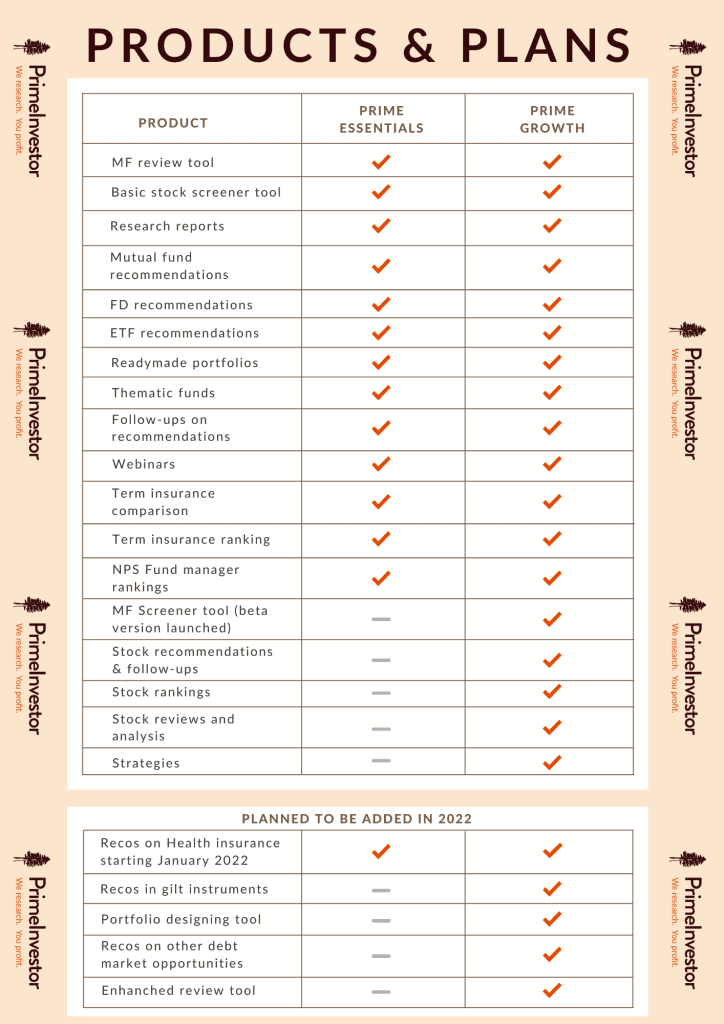
PS: Since a few of you have raised queries on why the MF Screener tool is being added to Growth when all mutual fund products come under Essentials, we wanted to clarify that the distinction between Essentials and Growth is not product wise (in fact Essentials too has a basic Stock screener tool). Essentials has mutual funds, ETFs, term insurance, FD recommendations, NPS and FD tool besides a Stock screener and will soon have health insurance recommendations. We think these are the basic products required for investing but largely complete by itself.
Any other advanced offering - whether in terms of product or features - in MFs and other products will be in Growth. Please see the image below to know what is currently being offered in Essentials and Growth and what are the proposed additions for Growth. You will see that many of the advanced new MF tools will soon be added to Growth. More nuanced products like gilt recommendations will also be under Growth.

