
The author is an external contributor. Views are personal and do not reflect the opinion and views of PrimeInvestor.
In the previous update on the Nifty 50 we had mentioned that 21,700-22,200 level was the immediate support zone for the Nifty 50 index. As anticipated, the index bounced off this support zone and has staged an impressive 8.7% rally off the low of 22,182 recorded on April 2, 2026.

The key question now would be, is the worst over for Nifty 50 index? And are we headed to new highs soon? We shall address the first question in this post. We feel that it would be slightly premature to address the second question at this juncture. We shall also look at the broad market performance and a few pointers that can help in identifying inflexion points.
Nifty Short-Term Outlook
Have a look at the daily chart of the Nifty 50 index featured below. The price is tracing out a bullish sequence of higher highs and higher lows after having bottomed out at 22,182 in early April. The short-term would be bullish as long as the price sustains above the recent swing low of 23,500.
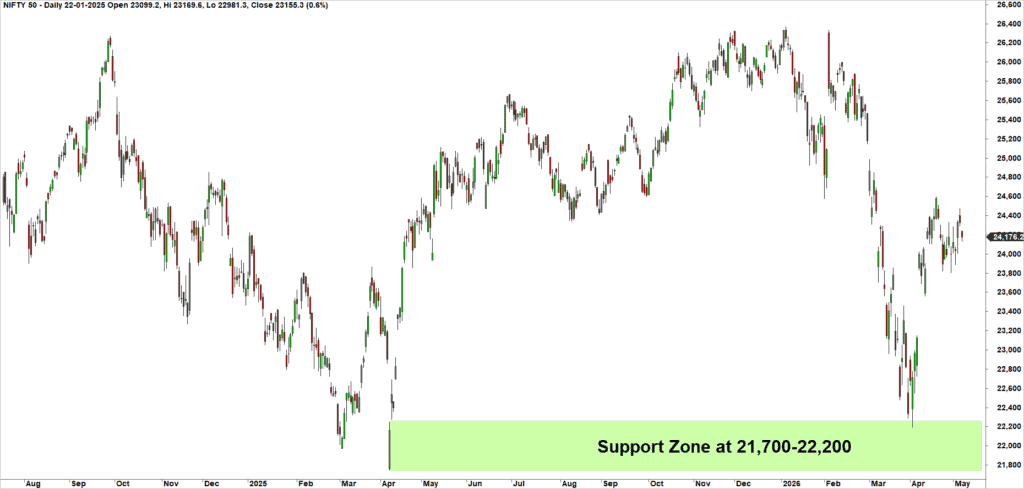
Technically, we feel that the index has to spend some time in the 22,200-25,400 zone before the resumption of a roaring bull market. But there are some early positive signs which has to be taken note of.
The first positive sign is the improvement in the market breadth of both the Nifty 50 index and the broader markets. The percentage of stocks trading above their 200-day moving average in the Nifty 50 universe has improved to 50% from the low of 20% recorded in late March 2026.
This metric for the Nifty 750 universe has also recovered to 51%. This suggests that the recovery in the Nifty 50 index has rubbed off positively on the broader markets too, which is a healthy sign. More importantly, the broader markets have displayed strong relative outperformance versus Nifty 50 index suggesting that one can now consider increasing exposures to the mid and small cap stocks.
As observed in the previous update, there are significant hurdles for the index at 24,400 and 25,400 levels. While the Nifty is likely to spend some time in the lower half of the broad range of 22,200-26,600 range, it appears that the broader market is the space to focus on.
Broader market outlook
Here is the performance of the broad market indices from the low of recorded on April 2, 2026 till date.
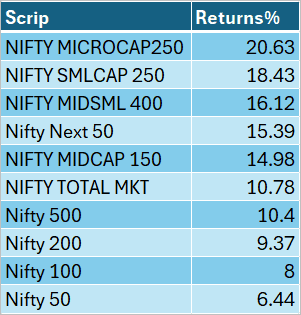
Notice how the Nifty 50 index has been the worst performer with a gain of 6.4% while the Microcap 250 index tops the table with an impressive 20.6% gains. The SmallCap 250 index is in the second slot with a 18.4% gain, suggesting that buying interest is creeping into these segments. The Nifty Midcap universe has displayed relative strength versus Nifty for a while now.
Have a look at the Nifty SmallCap 250 index chart featured below. The blue line in the chart represents the relative performance of this index in comparison to Nifty 50.
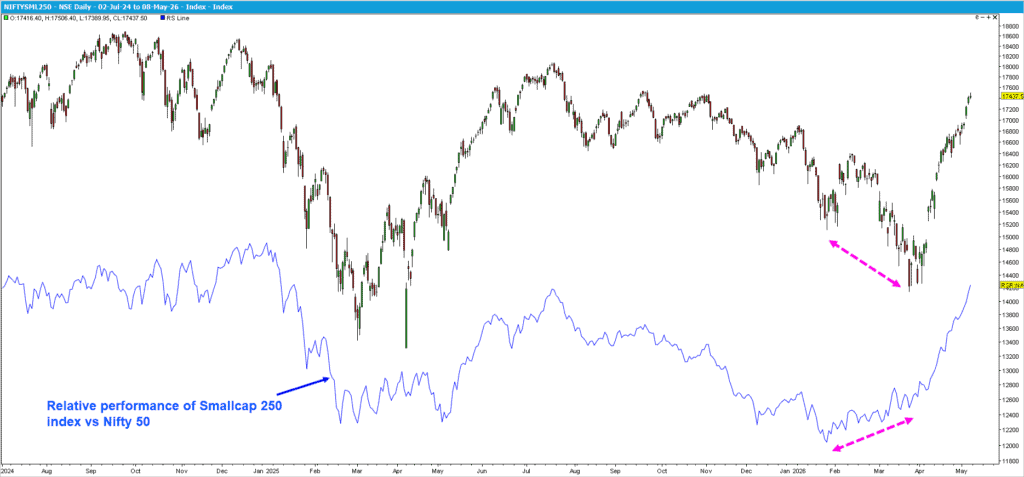
As highlighted in the chart above, there is a strong positive divergence between the price action and relative performance. While the SmallCap 250 index dropped to fresh lows, the relative performance line did not do so. This is an early sign that this index would turn out to be a strong outperformer when the market sentiment improves. This is exactly what happened once the Nifty 50 index staged a recovery since early April. A similar trend is noticeable in the MicroCap 250 index as well.
The broader message here is that the breadth and, more importantly, the relative performance of broader markets have displayed remarkable improvement during the recent market recovery. This is an early signal to consider exposures in these pockets. That said, do not go all-in right away and phase out your planned investments.
Sector outlook
We shall not dwell too much into the individual sector outlook or targets. But the key outperforming sectors include Nifty Chemicals, Nifty Media, Nifty Capital Markets and Nifty Pharma. The laggards are Nifty IT, Nifty Private Bank and Nifty Financial Services. Nifty Realty and Nifty Tourism are displaying promising signs. They could deliver impressive returns if the recent strength persists.
Market inflexion indicators
Before we wind up, let us take a simple framework to understand how market cycles behave and the tools one can use to identify potential market inflexion points. The basis for the framework discussed in this section is our adaption of the model discussed in the book “The Janus Factor: Trend Follower’s Guide to Market Dialectics” authored by Gary Anderson.
The simple logic here is that before the market tops out and gets into a reversal, there would be warning signals from the relative performance of the Nifty Alpha 50 index and Nifty High Beta50 index. When both these indices turn relative underperformers and the trend reverses in both the indices, it would be a signal that the prior bull market may be drawing to a close, and could be time to start getting cautious on aggressive deployments or phase out investments a bit more.
Featured below are the charts of Nifty Alpha50 index and Nifty High Beta 50 index along with their relative performance captured by the blue line.
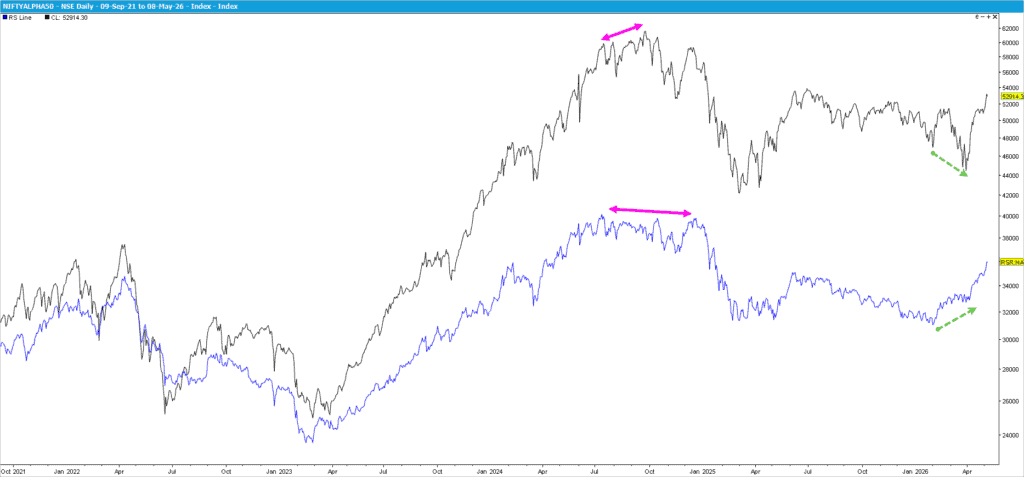
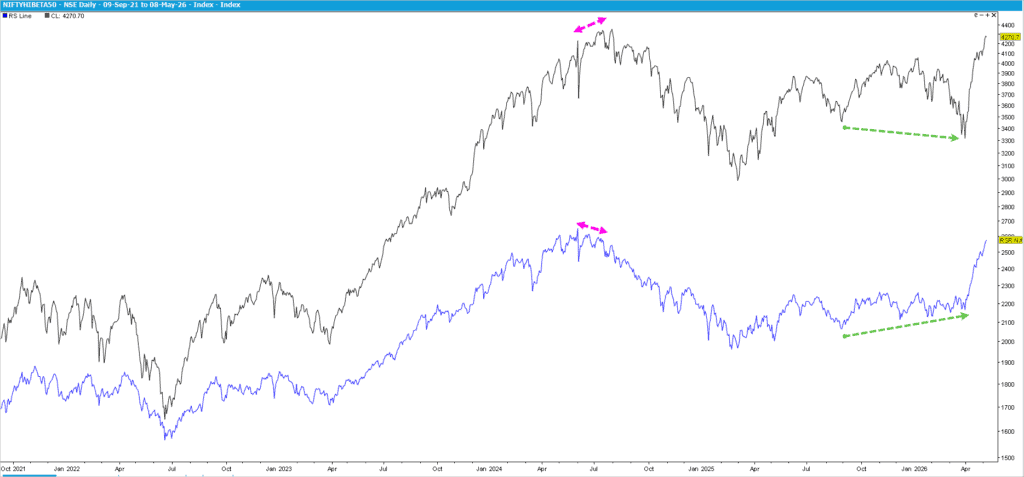
Notice how the Alpha50 index started displaying signs of underperformance since July 2024 even as both Alpha 50 and Nifty 50 indices were marching higher? Both these indices topped out in late September 2024, but Alpha 50 index commenced underperformance by then. This was an early sign that the bull market was about to get into trouble.
The confirmation comes when the Nifty High Beta50 index commences its downtrend and relative underperformance. This too happened by September / October 2024.
The sequence is deterioration in relative performance of the Alpha 50 index, followed by the deterioration in the relative performance of the High Beta 50 index. When both these indices commence their downtrend, it could serve as an indicator that the prior bull market could begin winding down over the next few months.
Similar logic holds good to identify potential market bottom too. Notice how both these indices displayed positive divergence in relative performance in early 2026. By April, both these indices started gaining strength and the trend in the Nifty 50 index too is displaying early signs of bullishness.
Therefore, it would be a good idea to track the performance and relative performance of these two indices. They can provide early warning signals of an impending market reversal. As always, wait for confirmation and focus on risk management and position size.
A word of caution here – while there is logic in using these indices as a forewarning of market reversals, the practical problem could be a slight lag in these signals because of the quarterly rebalancing of these indices. Due to the quarterly rebalancing, there can be an element of lag but they are effective clues to focus on.
Summary
The outlook for the Nifty 50 index is turning bullish, but these are still early days. Let us await more confirmation. The crucial confirmation would the percentage of stocks trading above their 200-day moving average from the Nifty 750 universe crossing the 75% mark. Aggressive investors can consider exposure in the mid, small and micro-cap stocks. Swing traders can also consider breakout trades in the outperforming stocks.






1 thought on “Technical outlook: Is the Nifty 50 headed for better times?”
Dear Krishnakumar / Bhavana / Vidya & Team,
Excellent and timely analysis.
Thanks and Regards
Rajiv Kumar Mendiratta